Article summary
- ARM Pensions Managers Limited ended 2022 with 889,124 RSA holders and N1.05tn in assets under management, both up from 2021 figures.
- The company’s total income for 2022 rose 13.84% to N12.74bn, with PAT growing 5.67% to N3.83bn, while returns for the different ARM Pensions Funds also improved.
- However, the cost-to-income ratio rose to 56.73%, up from 52.93% in 2021, and return on equity fell to 33.90% from 34.92%, with inflation and MPR also higher than pension fund returns.
ARM Pensions Managers Limited, also known as ARM Pensions, closed the year 2022 with 889,124 RSA holders, up from 852,416 RSA holders in 2021 and total RSA assets under management of N1,053.44bn, up from N915.78bn in 2021.
Company accounts
Total income for the year ended 31 December 2022 grew 13.84% to N12.74bn from N11.12bn the year before. Cost to income ratio rose to 56.73% from 52.93% in 2021 and 49.84% in 2020. This ratio has averaged 51.72% over the last 5 years. Profit After Tax (PAT) grew 5.67% to N3.83bn, roughly the same growth as 2021 at 5.69%.
Return on Equity fell to 33.90% from 34.92% the year before, whilst shareholders’ funds grew 8.83% to N11.28bn from N10.37bn in 2021.


Returns on RSA funds
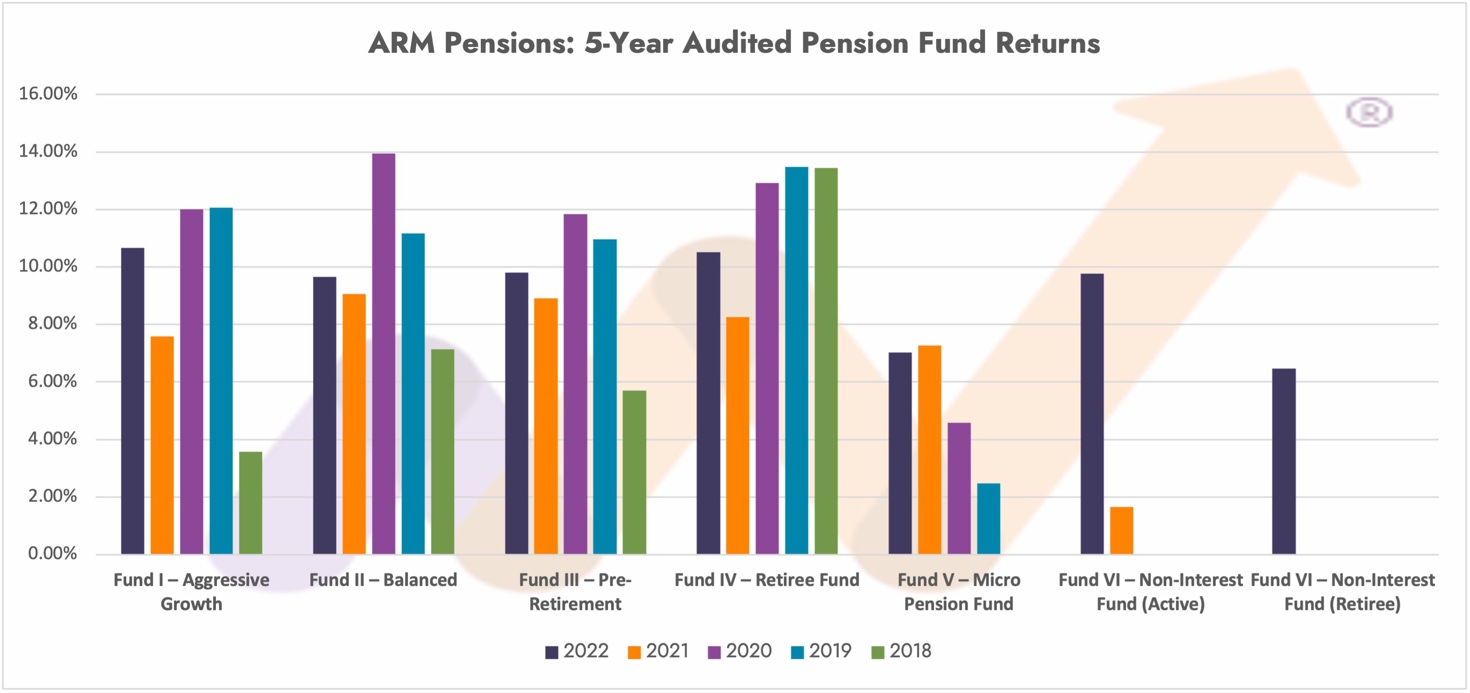
For the year 2022, Fund I returned 10.66%, Fund II 9.66%, Fund III 9.82%, Fund IV 10.51%, Fund V 7.02%, Fund VI – Non-Interest (Active) 9.77% and Fund VI Non–Interest (Retiree) 6.46%. ARM Pensions offers all 7 PenCom-approved funds to the public.
There are currently no benchmarks to which pension funds are measured. For the same period in 2022, the stock market returned 19.98%, inflation was 21.47% and MPR closed the year at 16.50%, having risen steadily through the year.

ARM Pensions Fund I

Returns generated for ARM Pensions Fund I RSA holders by the ARM Pensions fund managers for 2022 was 10.66% compared to 7.58% in 2021. Income earned in the fund rose 42.19% to N760.49mn from N534.86mn in 2021, with net gains from investing activities rising to N623.84mn from N411.48mn.
The fund’s expense ratio (this is the figure that captures the annual cost of managing the fund), fell to 2.03%% from 2.12%. Over the last 5 years, the ratio has averaged 1.95%.
This low average was due to 2019 having a low ratio of 1.59% as since after that year the ratio has been above 2%. In 2021 the fund ranked 4 out of 19 in terms of performance. The ranking for 2022 will be revealed in our 2023 report later in the year.
ARM Pensions Fund II

Income earned in the ARM Pensions Fund II was 19.70% higher than in 2021, rising to N60.28bn from N50.36bn in 2021, with net gains from investing activities rising to N50.67bn from N41.94bn.
The fund’s expense ratio also increased to 1.65% from 1.63%. Over the last 5 years, the ratio has averaged 1.84%, hence some improvements taking place. The fund managers generated a return of 9.66% in 2022 compared to 9.06% in 2021.
In 2021 the fund ranked 3 out of 19 in terms of performance. The ranking for 2022 will be revealed in our 2023 report later in the year.
ARM Pensions Fund III

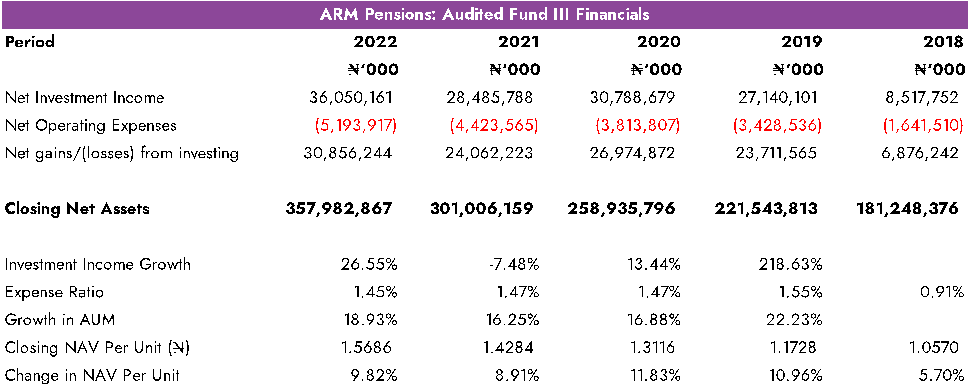
Income earned in the ARM Pensions Fund III grew 26.55% to N36.05bn from N28.49bn in 2021, with net gains from investing activities rising to N33.18bn from N23.12bn.
The fund’s expense ratio was slightly lower at 1.45% compared to 1.47% the year before. The 5-year average has been 1.37%. The fund managers generated a return of 9.82% in 2022 compared to 8.91% in 2021. In 2021 the fund ranked 1 out of 19 in terms of performance.
The ranking for 2022 will be revealed in our 2023 report later in the year.
ARM Pensions Fund IV

The ARM Pensions Fund IV returned a performance of 10.51% compared to 8.25% in 2021. Income earned by the fund grew 42.77% to N10.63bn from N7.44bn in 2021, with net gains from investing activities rising to N9.74bn from N6.75bn.
The fund’s expense ratio was 0.85% compared to 0.75% in 2021. The 5-year average has been 0.93%. In 2021 the fund ranked 9 out of 19 in terms of performance. The ranking for 2022 will be revealed in our 2023 report later in the year.
ARM Pensions Fund V

Income earned in the ARM Pensions Fund V grew 215.81% to N2.93mn from N0.93mn in 2021, with net gains from investing activities rising to N2.35mn from N0.83mn.
The fund’s expense ratio rose to 1.16% compared to 0.45% in 2021. The performance of the fund was 7.02%% in 2022 compared to 7.26% in 2021. In 2021 the fund ranked 8 out of 14 in terms of performance. The ranking for 2022 will be revealed in our 2023 report later in the year.
ARM Pensions Fund VI (Active)

Income earned in the ARM Pensions Fund VI (Active) grew to N106.74mn from N3.81mn in 2021, with net gains from investing activities rising to N88.90mn from N3.02mn.
The fund’s expense ratio had a big leap to 1.1.18% from 0.22%. The funds’ performance was 9.77% in 2022 compared to 1.66% in 2021 (2021 was a partial year). In 2021 the fund ranked 8 out of 11 in terms of performance. The ranking for 2022 will be revealed in our 2023 report later in the year.
ARM Pensions Fund VI (Retiree)

These are the first set of audited accounts for the ARM Pensions Fund VI (Retiree). Income earned by the fund was N15.23mn whilst net gains from investing activities were N13.90mn.
The fund’s expense ratio was 0.59%. Performance was 6.46% in 2022. This fund was not ranked in our 2022 report as no audited figures were available. The ranking for 2022 will be revealed in our 2023 report later in the year.
Coming out soon, our 2023 Annual Report on ALL Pensions. See our 2022 report here: the Money Counsellors Annual Report on Pensions (MCARP 2022) for a full analysis of all Pension Fund Administrators (PFA) in one single document.
The report presents a holistic review of the last five years of activities of all PFAs, and the funds managed, including a 5-year summary of company and fund accounts, ratios, fund performances, fund performance rankings vs. peers, asset allocation, AUM ranking, RSA ranking and much more.
Our data and information provided are based on public data, our regulatory intelligence effort, our archives, and other public sources such as Fund Managers, FMAN, Pension Fund Administrators (PFAs), PenOp, etc.
We have taken care to ensure that the information is correct, but MoneyCounsellors neither warrants, represents, nor guarantees the information’s contents, nor does it accept responsibility for any errors, inaccuracies, omissions, or inconsistencies contained herein.
Because past performance does not predict future performance, it should not be used to make an investment decision. We make no product recommendations. No news or research item on our website or in this document should be interpreted as a personal recommendation to buy, sell, or switch any investment. Investments and the income generated by the rise and fall in value, so you may receive more or less than you invested.

